Importing Data download data here
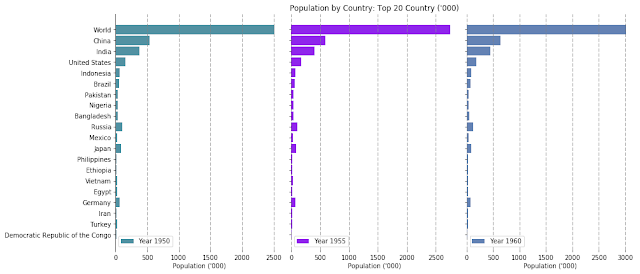
Let's have an automated way to plot all the Years in a single plot.

- import numpy as np
- import pandas as pd
- import matplotlib.pyplot as plt
- #Importing Data download data here
- df = pd.read_csv(r'F:\Python\Country_Population_Year.txt', sep='\t',
- low_memory=True, encoding='utf-8', error_bad_lines=False, thousands=',', header=0)
- df.set_index('Country or Territory', inplace=True)
- #display first n countries....
- n = 20
- #set y points and y labels.....
- y_pos = [i for i in range(n)]
- y_label = [i for i in df.index.tolist()[0:n]] #first 20 countries
- width = 0.85
- fig = plt.figure(figsize=(15,7), dpi=70)
- plt.subplots_adjust(left=None, bottom=None, right=None, top=None, wspace=0.05, hspace=None)
- ax0 = fig.add_subplot(311)
- plt.title("Population by Country: Top 20 Country ('000)")
- ax0.spines['left'].set_visible(False)
- ax0.spines['right'].set_visible(False)
- ax0.spines['top'].set_visible(False)
- ax0.spines['bottom'].set_visible(False)
- ax0.axes.get_xaxis().set_visible(False)
- ax0.axes.get_yaxis().set_visible(False)
- ax0.set_yticks([1])
- ax0.set_yticklabels([''], fontsize=0)
- ax1 = fig.add_subplot(131)
- ax2 = fig.add_subplot(132)
- ax3 = fig.add_subplot(133)
- ax1.spines['right'].set_visible(False)
- ax1.spines['top'].set_visible(False)
- ax1.spines['bottom'].set_visible(False)
- ax2.spines['left'].set_visible(False)
- ax2.spines['right'].set_visible(False)
- ax2.spines['top'].set_visible(False)
- ax2.spines['bottom'].set_visible(False)
- ax3.spines['left'].set_visible(False)
- ax3.spines['right'].set_visible(False)
- ax3.spines['top'].set_visible(False)
- ax3.spines['bottom'].set_visible(False)
- ax1.xaxis.grid(b=False, which='major', color='gray', linestyle='--')
- ax2.xaxis.grid(b=False, which='major', color='gray', linestyle='--')
- ax3.xaxis.grid(b=False, which='major', color='gray', linestyle='--')
- hbar1 = ax1.barh(y_pos, (df['1950']/1000).tolist()[0:n], width, align='center',
- color='#5291A2', ecolor='black',
- label='Year 1950')
- hbar2 = ax2.barh(y_pos, (df['1955']/1000).tolist()[0:n], width, align='center',
- color='#8F26EC', ecolor='black',
- label='Year 1955')
- hbar3 = ax3.barh(y_pos, (df['1960']/1000).tolist()[0:n], width, align='center',
- color='#6482B4', ecolor='black',
- label='Year 1960')
- ax1.set_yticks(y_pos)
- ax2.set_yticks(y_pos)
- ax3.set_yticks(y_pos)
- ax1.set_yticklabels(y_label, fontsize=10)
- ax2.set_yticklabels(['']*n, fontsize=10)
- ax3.set_yticklabels(['']*n, fontsize=10)
- ax1.invert_yaxis() # labels read top-to-bottom
- ax2.invert_yaxis() # labels read top-to-bottom
- ax3.invert_yaxis() # labels read top-to-bottom
- ax1.set_xlabel("Population ('000)")
- ax2.set_xlabel("Population ('000)")
- ax3.set_xlabel("Population ('000)")
- ax1.legend(loc='lower left')
- ax2.legend(loc='lower left')
- ax3.legend(loc='lower left')
- plt.show()

Let's have an automated way to plot all the Years in a single plot.
- import numpy as np
- import pandas as pd
- import matplotlib.pyplot as plt
- import random
- #Importing Data
- df = pd.read_csv(r'F:\Python\Country_Population_Year.txt', sep='\t',
- low_memory=True, encoding='utf-8', error_bad_lines=False, thousands=',', header=0)
- df.set_index('Country or Territory', inplace=True)
- #display first n countries....
- n = 20
- #Calculate total Years (columns)
- Year_N = len(df.columns)
- #set y points and y labels.....
- y_pos = [i for i in range(n)]
- y_label = [i for i in df.index.tolist()[0:n]] #first 20 countries
- width = 0.9
- fig = plt.figure(figsize=(50,7), dpi=100)
- plt.subplots_adjust(left=None, bottom=None, right=None, top=None, wspace=None, hspace=None)
- ax0 = fig.add_subplot(211)
- plt.title("Population by Country: Top 20 Country ('000)", fontsize=20)
- ax0.spines['left'].set_visible(False)
- ax0.spines['right'].set_visible(False)
- ax0.spines['top'].set_visible(False)
- ax0.spines['bottom'].set_visible(False)
- ax0.axes.get_xaxis().set_visible(False)
- ax0.axes.get_yaxis().set_visible(False)
- ax0.set_yticks([1])
- ax0.set_yticklabels([''], fontsize=0)
- color=[]
- for i in range(Year_N):
- r = lambda: random.randint(0,255)
- color.append('#%02X%02X%02X' % (r(),r(),r()))
- for i in range(Year_N):
- ax = fig.add_subplot(1,Year_N,i+1)
- if i == 0:
- ax.spines['right'].set_visible(False)
- ax.spines['top'].set_visible(False)
- ax.spines['bottom'].set_visible(False)
- else:
- ax.spines['left'].set_visible(False)
- ax.spines['right'].set_visible(False)
- ax.spines['top'].set_visible(False)
- ax.spines['bottom'].set_visible(False)
- ax.xaxis.grid(b=False, which='major', color='gray', linestyle='--')
- hbar = ax.barh(y_pos, (df[str(df.columns.tolist()[i])]/1000).tolist()[0:n], width,
- align='center', color=color[i], ecolor='black', label='Year: '+str(df.columns.tolist()[i]))
- ax.set_yticks(y_pos)
- if i == 0:
- ax.set_yticklabels(y_label, fontsize=10)
- else:
- ax.set_yticklabels(['']*n, fontsize=10)
- ax.invert_yaxis() # labels read top-to-bottom
- ax.set_xlabel("Population ('000)")
- ax.legend(loc='lower left')
- plt.show()
